How do relationship conflicts look from the other side? Here are answers from body-swapping in VR
By yong0021 on
Most people have ample experience with personal conflicts, whether it be a disagreement with your significant other, your mom, or just a really close friend. And most would agree that they are extra tricky to deal with: as seen in the 4-panel comic above, the real issue in this couple’s argument is not actually about the pizza. Just like how for arguments over who does the dishes at home, it’s usually not just about the dishes. Personal conflicts can involve differences in perspective that run deeper in the relationship and are hard to resolve via surface-level conversation.
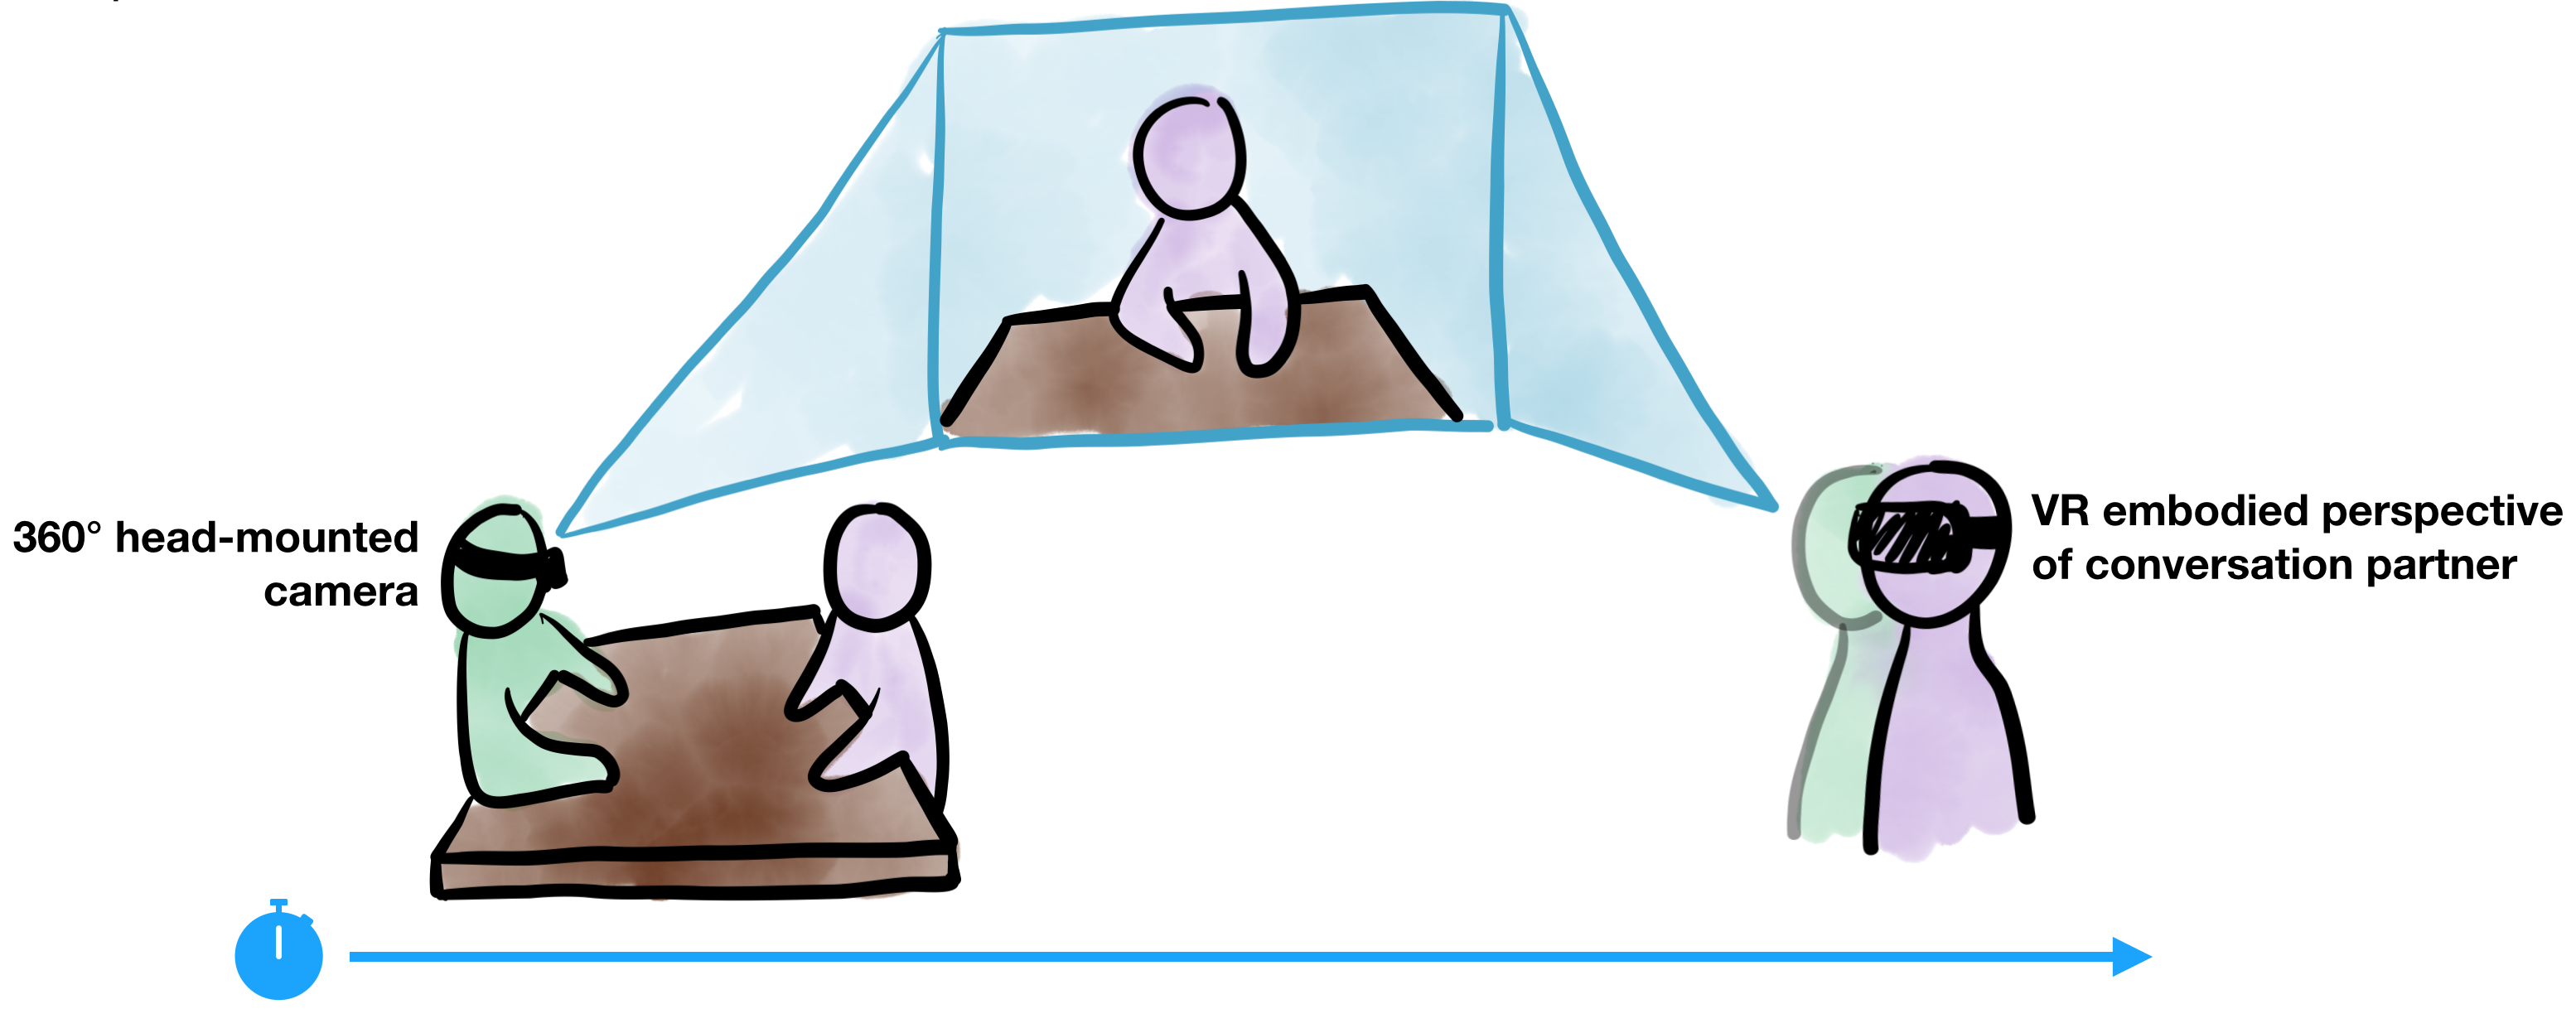
To really enable a change in perspective for those stuck in personal conflict, we propose and evaluate an autobiographically-accurate retrospective embodied perspective-taking system based in VR that enables users to immersively re-experience a past conflict interaction as their partner, essentially
“body swapping”:
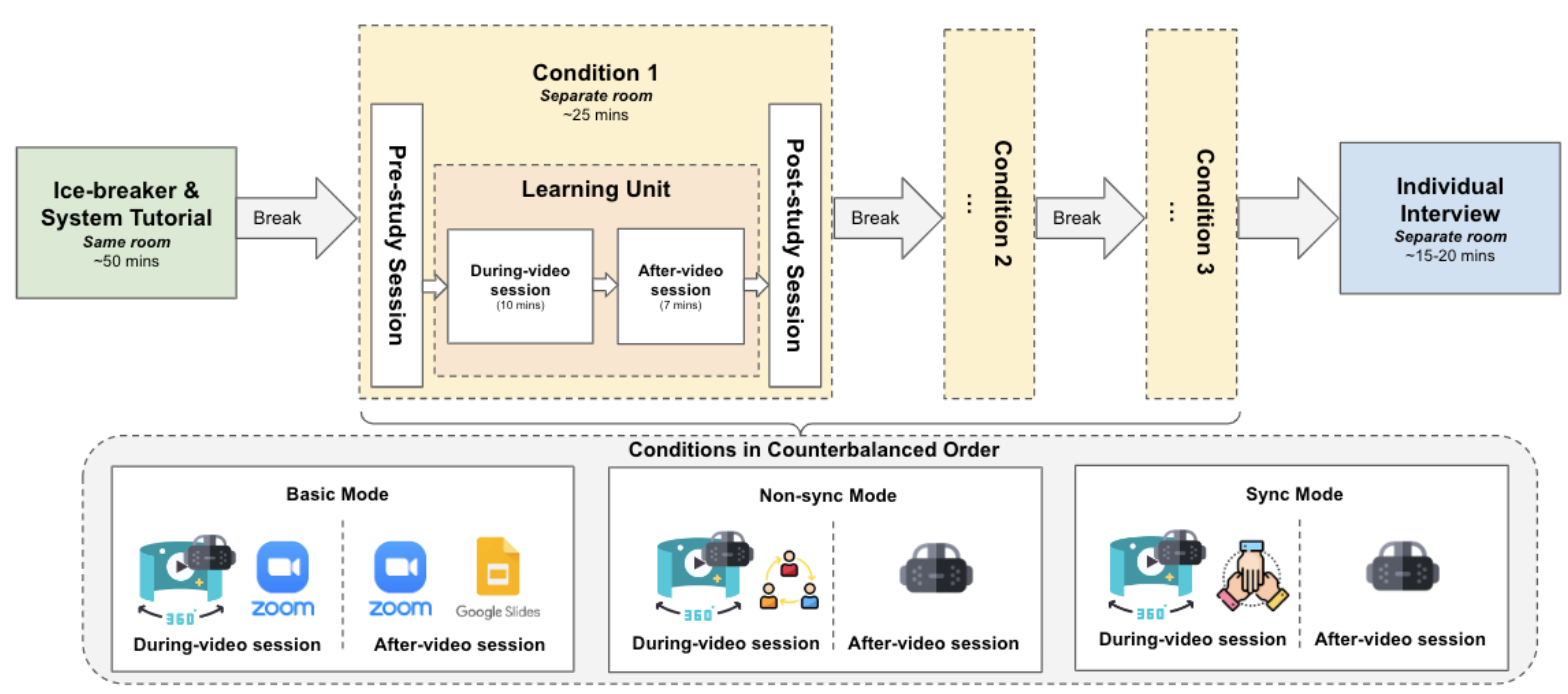
We conducted a mixed-methods controlled study with 26 couples to compare the types of insights and changes in conflict behavior evoked by our “body swapping” approach to the current industry practice of video recall—rewatching footage of both partners in a conversation.
We found that the experience of retrospective embodied perspective-taking led individuals who were in conflict with their significant other to develop transformative insights constituting major changes in opinion about their partner, themselves, and even the issues of conflict. One woman mentioned how the experience changed a negative view she had of her husband which had persisted throughout 10 years of their marriage prior to the study:
“I found a lot of value in watching his hands. My husband does a lot of repetitive hand movements when he’s nervous, and it tends to frustrate me, and make me feel like he is uncomfortable with what I’m saying. Watching him do it from his perspective, I felt uncomfortable vs. frustrated. Seeing myself talk to him the way I did, I can now understand why he would make those kinds of gestures because even ‘I’ was nervous with how absolute and sure I was when speaking to him.
I think my biggest realization is that I thought my husband was the major reason that we had trouble communicating. And while he might not like conflict, I spend a lot of time saying what he’s doing, versus what I’m doing. I have taken this approach to this conversation so many times, and hearing/watching myself from this point of view makes me think about how many times my partner has been on the receiving end of me pointing out things and for me, doing that it felt like, here we go again, but not from my standpoint, from his standpoint — of like, here she goes again.“
Our findings showed that addressing personal conflicts isn’t always about talking through the details of an issue — VR-enabled body swapping can help people understand what others are actually thinking and experiencing, which gets at the personal perspectives at the core of conflict in close others.
Want to see the full story on how embodied perspective-taking impacts conflict in close relationships? Check out our paper, or come watch my in-person talk on May 13, 2024 at 4:30pm Hawaii time!
Seraphina Yong, Leo Cui, Evan Suma Rosenberg, and Svetlana Yarosh. 2024. A Change of Scenery: Transformative Insights from Retrospective VR Embodied Perspective-Taking of Conflict With a Close Other. In Proceedings of the CHI Conference on Human Factors in Computing Systems (CHI ’24), May 11–16, 2024, Honolulu, HI, USA. ACM, New York, NY, USA, 18 pages. https://doi.org/10.1145/3613904.3642146