The MovieLens datasets are full of data describing how people rate movies. As it turns out, these datasets have been useful to lots of folks, from recommender systems researchers to the readers of popular-press programming books. Though it is difficult to measure the full extent of the datasets’ impact, we see that they were downloaded more than 140,000 times in 2014, and that the keyword “movielens” currently results in over 8,900 results in Google Scholar.
It is tempting to view these collections of ratings as a cohesive whole. However, the truth of the matter is that the datasets are the product of 17 years of member activity in a web site that has seen its fair share of changes and experimental features. Given the extent of attention — research and otherwise — given to these datasets, it seems worth exploring the relationship between the system and the resulting data.
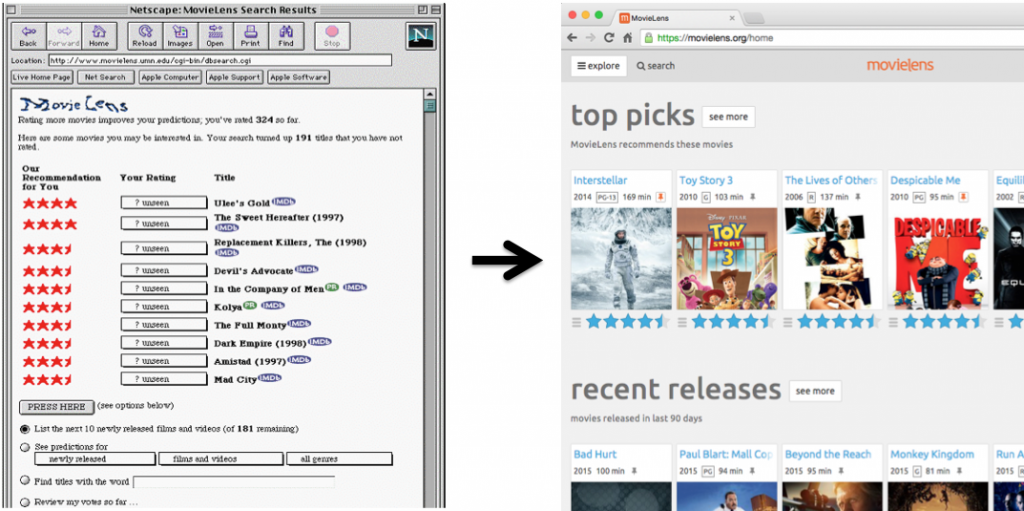
In MovieLens Datasets: Context and History, published in ACM Transactions on Interactive Intelligent Systems (TiiS), we detail the history of the MovieLens system with an eye towards understanding how changes in the system affect the resulting datasets. This article is now our most comprehensive description of how the MovieLens recommender started, and how it has evolved and been used since 1997.
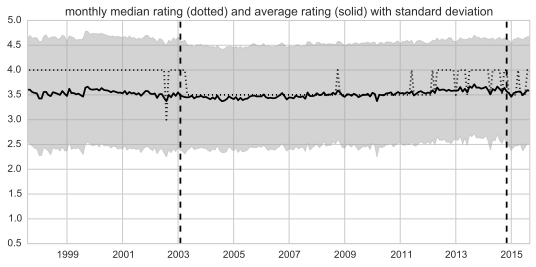
One result of pulling together 17 years of statistics is a surprising consistency in member rating behavior. For instance, we might expect that the major redesigns of the MovieLens ratings widget — including a shift from star ratings to half-star ratings in 2003 — to skew the contributions of ratings over time. Indeed, 17 years of user turnover, 17 years of changing user expectations concerning movies and online technologies, and 17 years of web site changes has led to a surprisingly consistent distribution of rating values stored in the MovieLens database. Here’s a visualization of the distribution:
This paper also pulls together descriptive statistics of the six MovieLens datasets and six of the most prominent alternative datasets. Alongside these statistics, we present usage guidelines and limitations. We hope practitioners and researchers who wish to find the most appropriate dataset for their work will find this collection useful.
Our lab is very interested in learning about current research that uses the MovieLens datasets. Therefore, we now ask authors of publications that reference the MovieLens datasets to cite this journal paper. Good luck with your research!
Harper, F.M. and Konstan, J.A. 2015. The MovieLens Datasets: History and Context. ACM Transactions on Interactive Intelligent Systems 5, 4 (Dec. 2015), 19:1–19:19.
- Direct link to author version: http://files.grouplens.org/papers/harper-tiis2015.pdf
- Version of record: http://dx.doi.org/10.1145/2827872